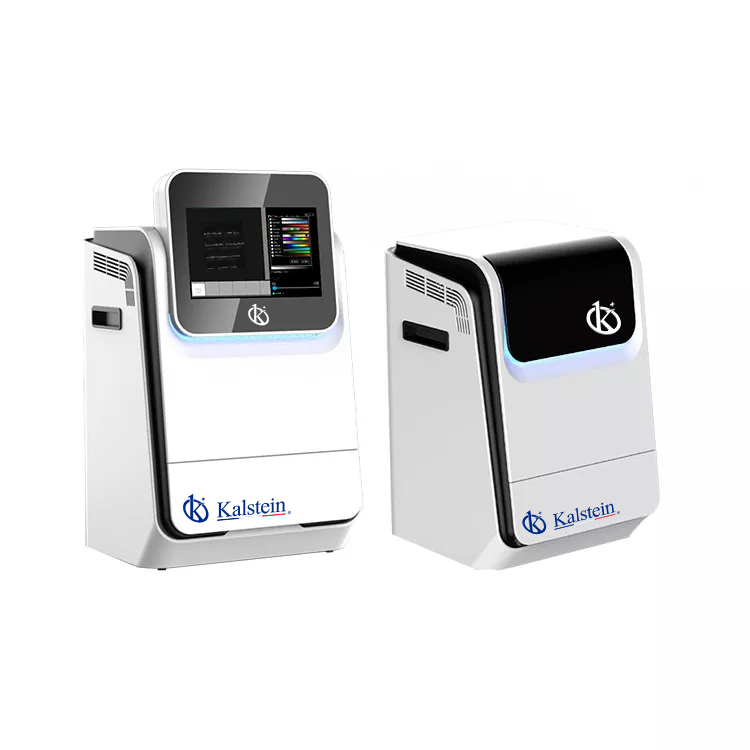
تفسير النتائج وقراءة القياسات مع نظام توثيق الجل YR06207
نظام توثيق الجل YR06207 هو حل مدمج وفعال وسهل الاستخدام مصمم لتلبية احتياجات توثيق الجل للحمض النووي والبروتين. يمكن للمستخدمين الاستفادة من كاميرته الرقمية عالية الدقة وبرامجه السهلة لتعزيز تفسير النتائج وقراءة القياسات. في هذه المقالة، سنركز على كيفية تفسير النتائج بفعالية وقراءة القياسات بدقة باستخدام YR06207.
فهم أهمية تفسير النتائج
تفسير النتائج هو عنصر حاسم في أي بيئة مختبرية، خاصة في علم الأحياء الجزيئي والكيمياء الحيوية. تضمن القراءة الدقيقة للقياسات من أنظمة توثيق الجل مثل YR06207 أن الباحثين يمكنهم استخلاص استنتاجات صحيحة من تجاربهم. إن فهم كيفية تفسير النتائج لا يساعد فقط في تحليل البيانات، بل يعزز أيضًا موثوقية وكرارية النتائج العلمية.
المواصفات الفنية لـ YR06207
| المواصفة | الوصف |
|---|---|
| النموذج | YR06207 |
| تطبيق توثيق الجل | نعم |
| جل البروتين؛ صفحات SDS | نعم |
| تصوير الفلورسنت | نعم |
| الدقة | 6.3 ميغابكسل، 3072×2048 |
| الكفاءة الكمية | 97% |
| كثافة البكسل | 16 بت (65536 تدرجات الرمادي) |
| العدسة | عدسة موتور F1.2 |
| البرمجيات | برنامج SHST للتصوير والتحليل لعدد غير محدود من المستخدمين |
وحدات القياس الشائعة وأهميتها
عند تفسير النتائج من YR06207، من الضروري التعرف على وحدات القياس الشائعة المستخدمة في توثيق الجل. عادة ما تقاس النتائج من حيث كثافة الشريط، الحجم (بالأزواج الأساسية)، والوزن الجزيئي (بالكيلودالتون). يوفر YR06207 قياسات دقيقة، مما يساعد المستخدمين على تحديد تركيز الحمض النووي أو البروتينات في عيناتهم. إن فهم هذه الوحدات وآثارها أمر حيوي لاستخلاص استنتاجات ذات مغزى.
قراءة العرض وتحليل النتائج
يتميز YR06207 بواجهة سهلة الاستخدام تعرض النتائج بتنسيق بديهي. بعد التقاط صورة للجل، يمكن للمستخدمين تحليل أنماط الشريط وكثافاته باستخدام البرنامج المدمج. تشمل الوظائف الرئيسية:
- قياس أحجام الأشرطة بناءً على علامات الوزن الجزيئي.
- تحديد كميات شدة الأشرطة لتقييم تركيزات العينات.
- تمثيل بصري واضح للنتائج لتسهيل تفسير البيانات.
لاستخدام هذه الميزات بشكل فعال، يجب على المشغلين التعرف على واجهة البرنامج، مما يضمن قدرتهم على التنقل عبر الصور الملتقطة والحصول على البيانات اللازمة للتحليل.
تفسيرات خاطئة شائعة للنتائج
يمكن أن تؤدي التفسيرات الخاطئة إلى استنتاجات غير صحيحة. إليك بعض الفخاخ الشائعة عند قراءة القياسات من YR06207:
- تقدير شدة الشريط بشكل مفرط: قد لا تشير الأشرطة ذات الشدة العالية دائمًا إلى تركيزات أعلى. ضع في اعتبارك استخدام منحنى قياسي للتحديد الدقيق.
- تجاهل الضوضاء الخلفية: يمكن أن تؤثر الفلورية الخلفية على القياسات. تأكد دائمًا من طرح الإشارة الخلفية عند تحليل النتائج.
- إهمال تأثير ظروف الجل: يمكن أن تؤدي التغيرات في تركيز الجل إلى نتائج غير متسقة. حافظ دائمًا على ظروف موحدة لمقارنات موثوقة.
أمثلة عملية على تفسير النتائج
لتوضيح التفسير الفعال للنتائج، ضع في اعتبارك السيناريو التالي باستخدام YR06207:
يُجري باحث عملية كهربائية للجل لتحليل عينات الحمض النووي. بعد التقاط صورة الجل باستخدام YR06207، يشير البرنامج إلى ما يلي:
- تظهر العينة A شريطًا عند 500 bp مع قراءة شدة تبلغ 2000 AU (وحدات تعسفية).
- تظهر العينة B شريطين عند 300 bp و700 bp مع قراءات شدة تبلغ 1500 AU و1000 AU، على التوالي.
في هذه الحالة:
- يمكن للباحث أن يستنتج أن العينة A تحتوي على تركيز أعلى من الحمض النووي المستهدف مقارنة بالعينة B، مما قد يشير إلى تضخيم ناجح.
- يمكن أن يكشف التحليل الإضافي للأشرطة في العينة B عن تباين جيني أو تفاعل غير مكتمل.
أسئلة متكررة
كيف يمكنني تفسير قراءات الشدة التي تم الحصول عليها من YR06207؟
تشير قراءات الشدة من YR06207 إلى تركيز الحمض النووي أو البروتين الموجود في العينة. عادةً ما تتوافق الشدة الأعلى مع التركيزات الأعلى، ولكن من الضروري استخدام المنحنيات القياسية للتحديد الدقيق.
ما هي العوامل التي يمكن أن تؤثر على دقة القياسات في YR06207؟
تشمل العوامل تركيز الجل، والجهد المطبق أثناء عملية الفصل الكهربائي، والظروف البيئية مثل درجة الحرارة والرطوبة. يجب اتباع بروتوكولات متسقة لتقليل التباين.
هل يمكنني استخدام YR06207 للتحليل الكمي؟
نعم، يمكن استخدام YR06207 للتحليل الكمي للبروتينات والحمض النووي. استخدام منحنى قياسي تم إنشاؤه من تركيزات معروفة يعزز الدقة في قياس العينات غير المعروفة.
كيف يمكنني ضمان أن النتائج قابلة للتكرار؟
لضمان القابلية للتكرار، حافظ على ظروف تجريبية متسقة، استخدم بروتوكولات موحدة، وقم بمعايرة YR06207 بانتظام. وثق أي انحرافات في المنهجية لتقييم تأثيرها على النتائج.
ما هي ميزات البرمجيات التي تساعد في تحليل البيانات على YR06207؟
يوفر برنامج SHST Capture and Analysis أدوات لقياس أحجام الأشرطة، وقياس الكثافات، وتصوير النتائج من خلال الرسوم البيانية والمخططات. التعرف على هذه الميزات يعزز عملية التحليل.
كيف يمكنني حل المشكلات الشائعة عند قراءة القياسات من YR06207؟
تشمل المشكلات الشائعة جودة الصورة السيئة، قراءات الكثافة غير الدقيقة، أو أخطاء البرمجيات. تأكد من ظروف الإضاءة المناسبة، تحقق من إعدادات المعايرة، واستشر دليل استكشاف الأخطاء للحصول على حلول محددة.
الخاتمة
تفسير النتائج وقراءة القياسات من نظام توثيق الجل YR06207 بشكل فعال أمر حيوي للتحليل العلمي الدقيق. من خلال فهم وحدات القياس، وتحليل النتائج، وتجنب الأخطاء الشائعة، يمكن للمستخدمين تعزيز نتائج أبحاثهم.
إذا كنت تبحث عن دمج الابتكار والجودة، فقد جئت إلى المكان الصحيح. في Kalstein، نقدم لك رفاهية استكشاف كتالوجنا الحصري من معدات المختبرات. نحن نصنع كل جهاز وفقًا لأعلى معايير التميز. قنوات الشراء عبر الإنترنت السلسة والبديهية لدينا مصممة لراحتك، مما يضمن لك أفضل الأسعار التنافسية. لا تتردد أكثر — نحن نجلب العلم إلى الحياة، حان الوقت لتصبح جزءًا من مجتمعنا.